Paint Price Trends at Home Depot
Monthly price index for October 2026. Updated 2026-10-17 from PriceWatchPro’s own price history.
What Paint prices are doing at Home Depot
PriceWatchPro tracks 655,285 in-stock products in Home Depot's Paint department. The median price is $46.17, and the middle half of the range runs from $27.98 to $128.00.
Comparing the same 1,880 products month by month, Paint prices are essentially unchanged compared with Jul 2026, and up 7.1% since Nov 2025, when this index starts.
In the last 30 days, less than 1% of the products in our sample had at least one price cut. Compared with 90 days ago, less than 1% cost less now, 1% cost more, and the rest haven't moved.
In our data so far, November 2025 was the cheapest month to buy Paint at Home Depot (index 100.0) and June 2026 the most expensive (107.1). That's based on 11 complete months; a seasonal pattern is only dependable once a full year has been tracked, so treat it as a guide rather than a rule.
Right now, 1% of the tracked items whose price has ever changed are at the lowest price we've recorded for them.
Paint price index at Home Depot
Same 1,880 products each month. Nov 2025 = 100; below 100 means cheaper than then.
| Month | Index | Change vs previous month |
|---|---|---|
| Nov 2025 | 100.0 | |
| Dec 2025 | 100.0 | 0.0% |
| Jan 2026 | 100.0 | 0.0% |
| Feb 2026 | 100.0 | 0.0% |
| Mar 2026 | 100.0 | 0.0% |
| Apr 2026 | 100.0 | 0.0% |
| May 2026 | 100.0 | 0.0% |
| Jun 2026 | 107.1 | +7.1% |
| Jul 2026 | 107.1 | 0.0% |
| Aug 2026 | 107.1 | 0.0% |
| Sep 2026 | 107.1 | 0.0% |
| Oct 2026 (so far) | 107.1 | 0.0% |
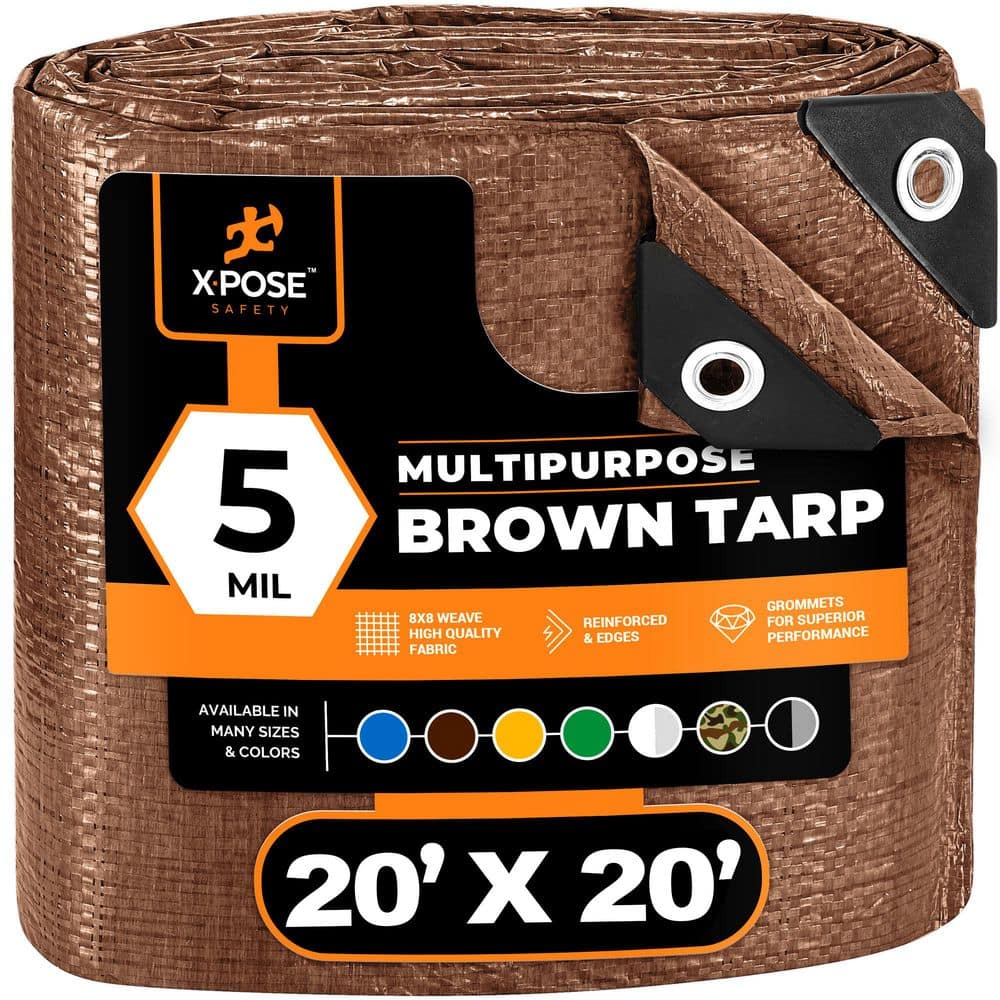
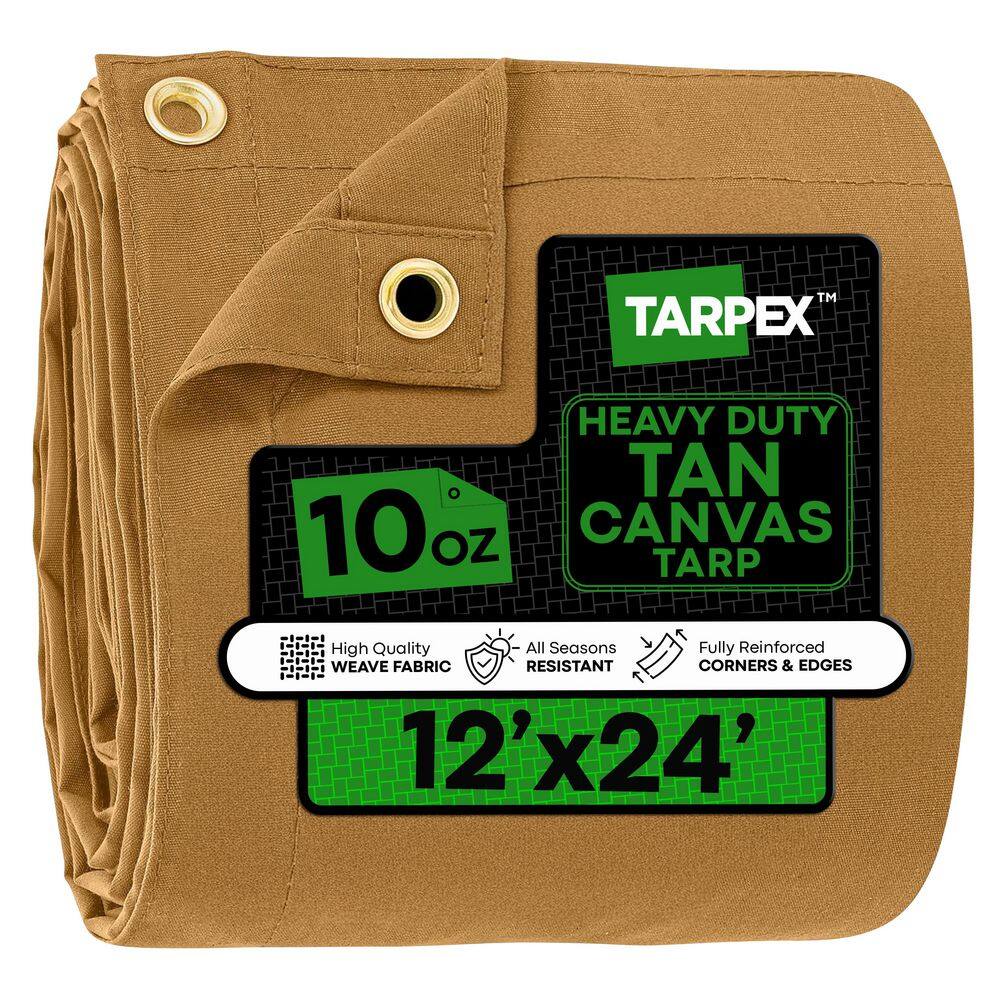
Biggest Paint price drops at Home Depot this month
Measured against each item’s own previous price on PriceWatchPro, not a retailer “was” price. Drops steeper than 70% and items whose price flips back and forth are left out, because those are usually feed errors rather than real deals.







How this index is calculated
We take a fixed random sample of up to 2,000 in-stock Paint products at Home Depot and look up every price we have recorded for each one. For each month, a product’s price is the last price recorded on or before the end of that month. The 1,880 products that already had a price in the first month form the panel, and each month’s index is 100 times the median of (that month’s price ÷ first-month price) across the panel.
Comparing every product only with itself means new, more expensive (or cheaper) products joining the catalogue don’t move the index — only real price changes do. Using the median keeps one bad feed row from moving a whole category. The current month is shown as “so far” until it ends.